Table of Contents
Understanding Antenna Gain
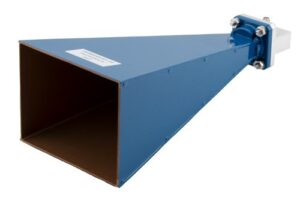
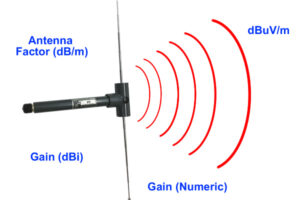
Antenna gain isn’t just a number—it’s your signal’s passport for cutting through noise and reaching farther. Think of it as a flashlight beam: a 24 dBi gain horn focuses energy 251× tighter than an isotropic radiator (10^ (24/10) = 251). For perspective, a standard 15 dBi Wi-Fi antenna covers ~500 meters, while a 25 dBi horn pushes that to ~2,200 meters in clear line-of-sight. But high gain trades wide coverage for precision—a 30 dBi horn might beam signals 50 miles to a satellite, yet miss a receiver just 15° off-axis.
Why Gain Isn’t a Solo Star
Gain depends heavily on physical size and operating frequency. Double an antenna’s length at the same frequency, and gain typically jumps 3 dB (a 2× power boost). But raise the frequency without changing size? You might see gain drop 6 dB due to mismatched wavelengths. Horns for 5 GHz WiFi often hit 20–25 dBi, while massive satellite horns at 3 GHz achieve 40+ dBi. Material loss also steals gain; aluminum horns average <0.5 dB loss, but poorly-coated steel can bleed 2 dB—halving your effective range.
“Peak gain specs assume perfect alignment. Real-world installation wobble or thermal warping can slice 10–15% off that number.”
The dB/dBi Trap
Always check the gain unit: dBi (vs. a theoretical isotropic source) is standard, but some datasheets sneak in dBd (vs. a dipole), which runs ~2.15 dB lower. A horn listed at 18 dBd = 20.15 dBi—a critical difference when budgeting link margins. For backhaul radios needing -70 dBm sensitivity, that 2 dB oversight could mean 30% shorter range.
Practical Takeaway
Target gain based on your minimum required signal strength, not the maximum possible. For urban drone control at 5.8 GHz, 18–22 dGi balances range and beamwidth. For lunar rover feeds? Crank it to 35 dBi. Test with a 5 dB margin above calculated needs—atmospheric absorption or rain fade can claw back gains fast.
Gain Measurements Explained
You see “24 dBi gain” on a datasheet—but how was that measured? Lab-tested gain values often don’t match real-world performance. Why? Because antenna gain isn’t a static number. It’s measured in controlled environments: anechoic chambers absorb 99.9% of reflections, but outdoors, ground bounce and buildings easily shave off 2–5 dB. For example, a horn rated at 28 dBi at 18 GHz might deliver just 23–26 dB in a crowded telecom tower site.
dB vs. dBi: Why Units Change the Game
The suffix matters more than you think. dBi (decibels relative to an isotropic radiator) is the gold standard. If a vendor says “20 dB” without the “i,” question it—it could be dBd (relative to a dipole), making actual gain ~22.15 dBi. That 2.15 dB difference equals 40% more range. Always demand dBi.
Testing Methods: Lab vs. Field Reality
Three methods dominate:
- Anechoic Chambers: Precision setup—but ignores environmental interference. Measures peak gain ±0.25 dB at one frequency.
- Three-Antenna Method: Compares gain between three antennas using transmitted power ratios. Real-world error: ±0.5 dB due to cable losses.
- Far-Field Range: Measures in open areas >2D²/λ away (e.g., 100m for a 1m horn at 6 GHz). Still vulnerable to wind, humidity.
Comparative Gain Measurement Methods:
| Method | Accuracy | Cost | Real-World Relevance | Key Limitation |
|---|---|---|---|---|
| Anechoic Chamber | ±0.25 dB | $100k+ | Low | Ignores multipath, weather |
| Three-Antenna | ±0.5 dB | $15k | Medium | Cable/connector loss errors |
| Far-Field Range | ±1.5 dB | $5k | High | Wind, terrain interference |
VSWR: The Gain Killer Nobody Talks About
Gain assumes perfect impedance matching. But if your Voltage Standing Wave Ratio (VSWR) hits 2.0:1, you lose 11% of radiated power—equivalent to 0.5 dB gain loss. For a 25 dBi antenna transmitting 50W, that’s 5.5W wasted as heat. Worse, at high frequencies (e.g., 28 GHz), a VSWR of 1.5:1 can still clip gain by 0.2 dB.
Calibration Certificates: Read the Fine Print
Trust but verify calibration dates. A horn’s gain drifts 0.05–0.1 dB/year due to material fatigue or connector wear. A certificate older than 24 months? Question it. Field recalibrate using known reference horns—a $50,000 standard horn ensures ±0.3 dB traceability to NIST.
Bandwidth Limits & Frequency
Think your horn antenna’s “2–6 GHz” spec means smooth sailing across all frequencies? Think again. Real operational bandwidth—where gain stays stable and VSWR stays low—is often 50–70% narrower than the marketing range. A horn rated for 6 GHz bandwidth might deliver reliable performance in just 3–4 GHz chunks. At 28 GHz, even a 0.5 dB gain dip could slash your EIRP by 12%, killing your link budget. Here’s why frequency and bandwidth are not linear partners.
Fractional Bandwidth: The Design Ceiling
Every horn has a fractional bandwidth (FBW) limit—a physics boundary determined by its flare geometry. FBW is calculated as:
FBW (%)=Center FreqUpper Freq−Lower Freq×100
Conical horns stretch to ~60% FBW but suffer wider beamwidths. Pyramidal horns (like most WiGig antennas) max out around 40% FBW but offer sharper beams. Push beyond your design’s FBW, and gain plummets or sidelobes spike. For example, forcing a 10 GHz pyramidal horn to run from 8–12 GHz (40% FBW) can create ±2 dB gain ripple.
Frequency’s Double-Edged Impact
Higher frequencies mean smaller antennas—but also tighter bandwidth tolerance. At 5–6 GHz, temperature swings of 30°C might shift gain by ±0.2 dB. At 24 GHz, the same swing causes ±0.8 dB drift due to wavelength sensitivity. Rain is worse: atmospheric absorption at 60 GHz eats 15 dB/km, turning wide bandwidth into wasted spectrum.
Typical Bandwidth Performance by Horn Type:
| Horn Type | Max FBW | Freq Range Example | Real-World Usable BW | Gain Flatness (±dB) |
|---|---|---|---|---|
| Standard Pyramidal | 40% | 24–30 GHz | 24.0–27.5 GHz | 0.75 |
| Corrugated | 20% | 8–12 GHz | 9.4–10.6 GHz | 0.25 |
| Conical | 60% | 1–2 GHz | 1.2–1.8 GHz | 1.25 |
| Dual-Mode | 70% | 4.0–7.0 GHz | 4.5–6.5 GHz | 0.5 |
Where Bandwidth Dies First
Bandwidth constraints bite hardest at the lowest and highest operating frequencies. Low-frequency cutoffs often choke from flare resonance mismatches (e.g., VSWR >2.0 below 3 GHz). High-end roll-offs stem from waveguide dispersion: a 12 GHz horn feeding a 15 GHz signal might leak >20% power into unwanted modes. Ground plane proximity matters too—a horn mounted <λ/4 above metal degrades bandwidth up to 15% due to induced currents.
Verification Tip
Use a vector network analyzer (VNA) to sweep beyond your target band. If VSWR crosses 1.5:1 within your “usable” range, recalculate gain with –0.8 dB padding. Always design with a 10–20% margin below datasheet bandwidth claims.
Patterns Matter
Your antenna’s radiation pattern isn’t just a polar plot—it’s the fingerprint of its real-world behavior. Beamwidth (the angle where power drops to half its peak) defines coverage, while sidelobes (those smaller lobes outside the main beam) leak signal where you don’t want it. For example, a standard 25 dBi pyramidal horn at 10 GHz typically has a 10° beamwidth. Tighter beams amplify range but make alignment critical: a 1° misalignment at 1 km deflects the beam 17 meters off-target—enough to miss a drone receiver entirely.
Beamwidth vs. Gain Tradeoffs
Beamwidth narrows as gain increases. Rough rule: beamwidth (°) ≈ 70 × λ / D, where λ is wavelength and D is aperture diameter. At 6 GHz (λ=5cm), a 30cm horn gives ~11.7° beamwidth and 25 dBi gain. But shrink that aperture to 15cm, and beamwidth widens to 23° while gain plummets to 19 dBi. This is why radar horns use massive apertures (2m+) for 0.3° precision, while Wi-Fi horns sacrifice gain for wider coverage.
Sidelobes: The Silent Saboteurs
Sidelobes aren’t just inefficiencies—they’re security risks and interference sources. A -13 dB sidelobe (common in basic horns) leaks 5% of your radiated power into adjacent directions. In a crowded 5G base station, this can trigger interference alarms on neighboring sectors. Corrugated horns suppress sidelobes to -25 dB (0.3% leakage), but add 40% weight and cost. Always check pattern cuts at multiple planes—asymmetry can create blind spots.
Nulls and Blind Zones
Every pattern has nulls—directions where signals vanish. Pyramidal horns often dip -20 dB at 45° off-axis. In satellite ground stations, this null becomes critical during satellite handovers. Measure patterns under actual mounting conditions. A horn tilted 10° upward for horizon coverage might unintentionally null a geostationary satellite at 25° elevation.
Environmental Pattern Distortion
Metal structures within λ/2 (15cm at 1 GHz) scatter your beam. On cell towers, ladder rungs near a 700 MHz horn can widen beamwidth by 3°—equivalent to a 1.5 dB gain hit. Even rain reshapes patterns: 30mm/hr downpour at 38 GHz diffracts beams, scattering energy and bloating sidelobes by 2-4 dB. Always run pattern tests outdoors if your budget allows.
The Alignment Reality Check
Calibrate azimuth/elevation mounts with a laser collimator. For long links, thermal expansion shifts patterns: an aluminum mount in desert sun expands 0.01% per 10°C, skewing aim by 0.1° at 1 km. That “negligible” shift equals -0.8 dB signal loss for a 30 dBi horn. Budget for ±0.25° stabilizers on critical paths.
Key takeaway: Simulated patterns lie. Field-verify with a spectrum analyzer and calibrated horn. Sacrificing 1 dB of gain for wider beamwidth often beats costly alignment headaches.
Input Impedance Checks
Think you’re safe because your horn claims “50 Ω impedance”? Reality check: Real-world impedance shifts constantly with frequency, temperature, and even humidity. A mismatch might seem small on paper—say, VSWR 1.5:1—but it bleeds 4% of your radiated power as heat. For a 500W satellite uplink horn, that’s 20W cooked into the feed, causing thermal drift that worsens impedance over time. Field measurements show 50 Ω horns drifting to 42–58 Ω across their rated bands, forcing amplifiers to work harder.
Why VSWR Isn’t the Whole Story
VSWR measures reflected power—a 2.0:1 ratio means 11% lost signal—but ignores phase shifts and reactive components. At 28 GHz, phase mismatches rot signal integrity: a 5° error on a phased array horn degrades beamsteering by 0.75°. Worse, older horns develop impedance “hotspots” – corrosion or bent connectors create local capacitance/inductance, pushing VSWR from 1.2:1 to 3:1+ at specific frequencies.
Critical Measurement Methods:
- Vector Network Analyzer (VNA): Gold standard. Sweep impedance across your band. Requires calibrated cables (±0.1 dB loss max).
- Fixed-Load Test: Dummy load comparison. Fast but blind to frequency dips – misses 20% mismatch spikes at band edges.
- Time-Domain Reflectometry (TDR): Finds where problems start. Spots connector corrosion 3cm into the waveguide.
“I’ve seen aircraft radars fail certification because vibration changed a horn’s impedance by 7 Ω—simulations assumed perfect rigid mounts.”
Temperature’s Stealth Impact
Aluminum expands 23 µm/m per °C. A 40°C desert swing elongates a 2m Ka-band horn by 1.84 mm – enough to shift impedance by 6 Ω. At 26 GHz, this causes 0.3 dB gain loss from detuning. Polymer-sealed connectors fare worse: humidity ingress shifts capacitance, increasing VSWR by 0.2 per 60% RH change.
Connectors: The Weakest Link
N-type connectors often rate to 11 GHz—but exhibit ±2 Ω impedance variance above 8 GHz. Precision 2.92mm connectors maintain 50±0.25 Ω to 40 GHz but cost 8× more. Never over-tighten: 0.3 N·m torque limit avoids center pin deformation that can trash VSWR.
Phased Arrays: Impedance’s Domino Effect
When horns array, mutual coupling warps impedance. A 3 dB mismatch in one horn propagates timing errors. For 5G mmWave arrays at 28 GHz, we see up to 12° phase errors from impedance drift in adjacent elements—blurring beams by 20%. Fix: Measure impedance in situ with couplers, not isolated.
Field-Verification Protocol
- Sweep VSWR after installing all cables/radomes.
- Test at min/max operating temperatures (cold soak + sun load).
- Shake mounts to check vibration stability (±3 Ω shift = fail).
- For arrays: Measure active impedance per element.
If VSWR >1.35:1 across >10% of your band, redesign feeds or add tuning stubs.
Polarization Control Needs
Think polarization alignment is just “nice to have”? Try losing 20 dB of signal because your circularly polarized (CP) horn tilted 15°. That’s 99% of your energy vanishing—equivalent to swapping a 100W transmitter for a 1W unit. At Ka-band (26–40 GHz), just 3° polarization skew slices gain by 1.5 dB. Real-world example: A drone telemetry link at 5.8 GHz dropped packets constantly until we found wind vibrating the horn, inducing ±8° linear polarization drift that killed the mismatch budget.
Axial Ratio: CP’s Silent Killer
Circular polarization quality hinges on axial ratio (AR)—how “circular” the waves stay. Perfect CP = 0 dB AR (impossible). <3 dB AR is workable, but:
- 1 dB AR = 0.15 dB signal loss
- 2 dB AR = 0.75 dB loss
- >3 dB AR = Near-linear behavior (20+ dB cross-pol loss)
Satellite horns often specify 1.5 dB AR at boresight but degrade to 4 dB AR at 20° off-axis. For low-Earth orbit tracking, this means signal dips during slewing.
Frequency Changes the Game
Polarization purity plummets at band edges. A horn rated for LHCP at 10–12 GHz might leak -10 dB cross-pol at 10.2 GHz and -6 dB at 11.9 GHz—invisible on boresight but disastrous at elevation. Rain worsens this: 15 mm/hr precipitation at 38 GHz depolarizes signals, increasing cross-pol isolation from 30 dB to just 18 dB.
Polarization Challenges Across Bands:
| Scenario | Frequency | Impact on Signal | Mitigation Cost |
|---|---|---|---|
| Urban multipath bounce | 3.5 GHz | -12 dB cross-pol | $300 (tilter) |
| Rain depolarization | 28 GHz | +8 dB loss | $1.5k (AR feed) |
| Horn vibration | 5.8 GHz | ±8° linear tilt | $120 (dampers) |
| Radome icing | 18 GHz | 3 dB AR → 6 dB | $700 (heaters) |
The Feed Integration Trap
Even perfectly polarized horns suffer if the feed is misaligned. A 1 mm offset between horn throat and waveguide feed at 60 GHz induces 15° polarization tilt. Pro tip: Use alignment pins during assembly and measure cross-pol on-axis and at ±20°. If your LHCP horn shows >-15 dB RHCP rejection at beam edges, rework the feed.
Field-Calibration Quick Fixes
- Linear Systems: Rotate the horn until null is 50% deeper than mismatch loss.
- CP Systems: Measure axial ratio with a dual-polarized probe horn—values >2.5 dB demand feed realignment.
- Phased Arrays: Program polarization correction vectors per element; humidity changes require monthly recalibration.
Material Choices & Handling
That shiny anodized horn might look indestructible, but material science doesn’t lie. Aluminum alloy horns (6061-T6) dominate for good reason: their thermal conductivity (167 W/m·K) prevents hot spots that warp patterns. But cheap steel alternatives? Conductivity drops to 50 W/m·K—causing localized heating that mis-shapes the flare by 0.05mm at 40°C. Result? Gain drops 0.8 dB at 30 GHz and sidelobes flare by 3 dB. And that’s before corrosion sets in.
The Corrosion Trap
Salt spray tests lie. Labs use 5% NaCl for 500 hours to simulate “20-year coastal life.” Real-world data from offshore rigs shows pitting starts after just 90 days if protective coatings dip below 25µm. Zinc-nickel plating adds 0.2 dB loss from surface roughness—yet still outperforms powder-coated steel horns that bloat VSWR by 15% when rust lifts the skin off.
“We replaced 37 steel horns on a wind farm after 18 months. Salt crystallization had eaten waveguide walls thin enough to dent with a fingernail—mismatched impedance sliced gain up to 2 dB.”
Surface Finish’s Hidden Toll
Machine marks matter more at high frequencies. An RMS surface roughness >4 µm scatters waves like gravel:
- 10 GHz: 0.15 dB loss
- 28 GHz: 0.4 dB loss
- 60 GHz: 1.2+ dB loss
Electropolishing aluminum achieves <1 µm roughness for minimal loss, but adds cost. Cheaper abrasion methods risk micro-cracks—humid environments grow oxide films that thicken conductors, choking GHz signals.
Thermal Expansion: Your Silent Enemy
Aluminum expands 23 µm per meter per °C. A 2-meter horn swinging from -30°C to +50°C grows 3.7 mm longer. If mounted rigidly at both ends? The flare distorts asymmetrically. One Arctic radar site saw beam shift 0.8° during storms—enough to lose low-orbit satellites. Always use slotted mounts with +5 mm thermal play.
Handling Blunders That Cost dB
- Throat dings: A 0.3 mm dent in the waveguide throat spikes VSWR to 2.5:1 at resonance frequencies.
- Flare finger oils: Human oils accelerate corrosion 200% in sulfur-rich air. Always glove up.
- Improper lifting: Side-mounting 40+ dBi horns (>100 kg) bends the neck joint. The fix? Lift from the flange using a spreader bar—no exceptions.
Radome Nightmares
Polycarbonate radomes absorb 10–15% signal at 24+ GHz. Rexolite® (ε<sub>r</sub>
=2.54) costs 4× more but cuts loss to 2%. For millimeter-wave systems, even radome frost adds 0.3 dB attenuation—slap on silicon nitride heaters or design drain angles >30°.
Key lesson: Spec surface treatments for your environment. Gold plating saves Ka-band horns but wastes money in dry interiors. Anodized aluminum wins 80% of cases—just demand >25µm thickness.
Reality-Check Takeaways
- Expansion Math: 23µm/m/°C thermal growth ≠ theoretical when flares deform
- Corrosion Timelines: 90-day field failure vs. 500-hr lab salt spray
- Precision Handling: 0.3mm dents = immediate VSWR disaster
- Radome Tradeoffs: Rexolite’s cost vs. polycarbonate’s signal theft


