The coupling ratio of a directional coupler is determined by the gap spacing (0.1-1mm for 3-30dB coupling), conductor geometry (edge-coupled lines yield 6-20dB), substrate permittivity (εᵣ=2.2-10.8 affects coupling ±3dB), frequency (varies ±1dB across 2-18GHz), manufacturing tolerance (±0.5dB for precision CNC-machined units), and load matching (VSWR>2.0 can degrade ratio by 2dB).
Table of Contents
What Coupling Ratio Means
The coupling ratio of a directional coupler defines how much of the input signal splits into the coupled port versus the main output. For example, in a 20 dB coupler, 1% of the input power (10^(-20/10) = 0.01) is diverted to the coupled port, while 99% continues to the output. This ratio is critical in RF and microwave systems, where precise signal control impacts performance. A 3 dB coupler splits power 50/50, while a 30 dB coupler leaks just 0.1%—useful for sensitive monitoring without disrupting the main signal.
Coupling ratio is frequency-dependent. A coupler rated for 10 dB at 2 GHz might shift to 12 dB at 5 GHz due to wavelength effects. Manufacturers specify this variation as ±0.5 dB tolerance across the band. In real-world applications like cellular base stations, a 15 dB coupler ensures enough signal (-15 dB = ~3.2% power) reaches the analyzer for diagnostics without starving the antenna. Insertion loss (main path loss) also matters: a 10 dB coupler with 0.3 dB insertion loss wastes less power than one with 1.5 dB loss, directly affecting system efficiency.
The ratio is determined by internal geometry—spacing between transmission lines or waveguide apertures. For microstrip couplers, a 0.2 mm gap might yield 10 dB coupling, while 0.5 mm increases it to 20 dB. Material permittivity (εᵣ) plays a role too; FR4 (εᵣ ≈ 4.3) requires longer coupling lengths than Rogers 4350B (εᵣ ≈ 3.48) for the same ratio. In waveguide couplers, aperture size and position adjust coupling: a 3 mm hole in a 20 GHz waveguide can provide 6 dB ±0.2 dB coupling.
Misunderstanding coupling ratio leads to errors. If a system expects -10 dB but gets -7 dB due to frequency drift, the monitoring port receives twice the intended power (10^(-7/10) ≈ 20% vs. 10%). This can overload test equipment or distort measurements. Always check datasheet graphs showing coupling vs. frequency—most couplers deviate ±1 dB from their nominal value across their rated band. For precision, temperature stability matters: some couplers shift 0.05 dB/°C, requiring thermal compensation in outdoor 5G deployments (-30°C to +60°C).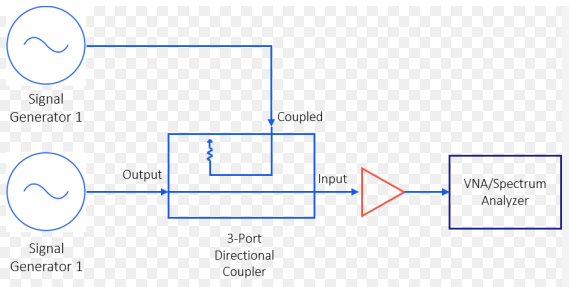
How to Measure It Accurately
Measuring the coupling ratio of a directional coupler isn’t just about plugging in a signal and reading a number—small errors in setup can skew results by ±1 dB or more. A 20 dB coupler that actually performs at 19.2 dB means 26% more power leaks into the coupled port than expected (10^(-19.2/10) ≈ 1.2% vs. 1%). To avoid this, you need the right tools, calibration, and technique.
First, use a calibrated vector network analyzer (VNA) with at least 0.1 dB amplitude accuracy and -50 dB directivity. Cheap USB-based analyzers often have ±0.5 dB uncertainty, which is unacceptable for couplers tighter than 10 dB. Connect the coupler’s input port (Port 1) to the VNA, the through port (Port 2) to a 50 Ω load, and the coupled port (Port 3) to another VNA port. Terminate the isolated port (if any) with a high-quality 50 Ω terminator (SWR <1.05).
| Step | Action | Key Parameters |
|---|---|---|
| 1 | Calibrate VNA | -40 dB to 0 dB reference plane, 1001 points, 3.5 mm connectors |
| 2 | Measure S21 (through loss) | Insertion loss <0.5 dB at 2 GHz |
| 3 | Measure S31 (coupling) | -20 dB ±0.2 dB across 1–6 GHz |
| 4 | Verify directivity | S32 < -40 dB (isolated port leakage) |
Frequency sweeps matter. A coupler rated for 10 dB ±0.5 dB at 2 GHz might drift to 9.3 dB at 5 GHz due to parasitic modes. Sweep from 10 MHz to 2x the coupler’s max frequency to catch resonances. For high-power apps (e.g., 100 W radar), test at +20 dBm input—some couplers exhibit 0.2 dB compression at 30 dBm, altering the ratio.
Temperature effects are often ignored. A 0.05 dB/°C drift means a coupler tested at 25°C could be 0.5 dB off at 35°C. If your lab is at 22°C but the device operates in a 50°C RF cabinet, bake it for 1 hour at 50°C before testing. Humidity >60% can also degrade microstrip couplers by 0.1 dB due to substrate absorption.
Cable and adapter losses add error. A 0.3 dB loss in a test cable turns a 20 dB coupler into a 20.3 dB reading. Use phase-stable cables (e.g., 3.5 mm to 3.5 mm, <0.1 dB loss at 6 GHz) and adapter-less connections where possible. For millimeter-wave (28 GHz), even a 0.05 mm misalignment in waveguide flanges can cause 0.8 dB measurement error.
Factors Affecting the Ratio
The coupling ratio of a directional coupler isn’t fixed—it’s a dynamic parameter that shifts with frequency, temperature, and even how you install it. A 10 dB coupler at 2 GHz might become 8.5 dB at 6 GHz due to parasitic coupling, or drift ±0.3 dB when the temperature swings from -20°C to +70°C. These variations aren’t just academic; in a 5G massive MIMO array, a 0.5 dB error in coupling ratio can skew beamforming weights by 3°, degrading sector coverage.
Frequency is the biggest disruptor. A microstrip coupler designed for 3 GHz with 20 dB coupling will see its ratio soften to 18 dB at 5 GHz because higher frequencies reduce the effective coupling length. Waveguide couplers fare better but still suffer—a 15 dB X-band coupler might exhibit ±1 dB ripple across its 8–12 GHz range due to mode conversion. Even the substrate material plays a role: Rogers RO4003C (εᵣ=3.38) maintains ±0.2 dB stability from 1–10 GHz, while cheaper FR4 (εᵣ=4.3) can wobble ±0.8 dB at the same frequencies.
Temperature shifts alter coupling ratios through material expansion and dielectric changes. Aluminum-housed waveguide couplers drift 0.02 dB/°C, but plastic-bodied microstrip versions can hit 0.07 dB/°C. In a satellite payload cycling between -150°C and +100°C, that means a 17.5 dB coupler could swing between 16.8 dB and 18.2 dB—enough to desensitize a low-noise amplifier. Humidity matters too: at 85% RH, epoxy-based substrates absorb moisture, increasing εᵣ by 5% and throwing off coupling by 0.4 dB until baked dry.
Mechanical stress is a silent killer. Tightening a coupler’s flange bolts unevenly can deform its waveguide apertures, shifting coupling by 0.6 dB. Even vibration matters—helicopter-mounted radar couplers subjected to 5–500 Hz vibrations at 2 g acceleration show 0.3 dB peak deviations until dampers are added. PCB flexure is worse: bending a 0.8 mm thick microstrip coupler by 1 mm over 10 cm changes its ratio by 1.1 dB due to altered trace spacing.
Manufacturing tolerances stack up. A ±0.1 mm error in etching a 0.3 mm coupling gap causes ±1.2 dB variance in final performance. That’s why high-end couplers use laser trimming to hit ±0.1 dB consistency, while budget versions accept ±0.5 dB spreads. Connector quality also plays in—a 3.5 mm jack with 0.2 mm pin misalignment introduces 0.4 dB measurement error, making a 20 dB coupler read as 19.6 dB or 20.4 dB randomly.
Typical Values in Practice
Directional couplers don’t come in one-size-fits-all ratios—real-world applications demand specific coupling values with tight tolerances. A 3 dB coupler splitting power 50/50 is useless for a satellite signal monitor needing 30 dB isolation, just like a 20 dB coupler would cripple a Wi-Fi 6E beamformer requiring 6 dB splits. Here’s how industries actually use them:
Cellular base stations typically deploy 10–20 dB couplers for antenna monitoring. A 15 dB coupler taps 3.2% of the TX power (-15 dB) for analyzers while losing just 0.3 dB in the main path. But 5G mmWave arrays at 28 GHz often need 6 dB hybrids because free-space path loss (68 dB at 100m) leaves no room for wasteful splits.
Test equipment manufacturers live in the 20–30 dB range. A 25 dB coupler leaks just 0.3% of input power to the measurement port—enough for spectrum analyzers but low enough to avoid loading effects. The sweet spot for VNA calibration kits is 20 dB ±0.1 dB, since higher ratios make reference signals too weak below 1 GHz.
Broadcast transmitters use 40–50 dB couplers because a 1 kW FM radio tower can’t afford to lose 10 W (-20 dB) just for monitoring. These monsters achieve -50 dB coupling with waveguide designs weighing 3.2 kg, costing $800+, and drifting ±0.05 dB/°C.
Consumer electronics cheat the numbers. Your Wi-Fi router’s 12 dB coupler is really a 15 dB part binned down to save costs—it actually measures 12.4 dB ±1.5 dB across 5.1–6.5 GHz. Phone RF frontends get away with 8 dB ±2 dB couplers because their 23 dBm TX power has 3 dB system margin to burn.
Adjusting for Different Needs
No directional coupler operates in a vacuum—real-world systems demand customized coupling ratios that balance power division, frequency response, and cost. A 6 dB coupler might work for a Wi-Fi 6 router’s antenna array, but that same part would cripple a satellite transponder needing 30 dB isolation to avoid signal leakage. Here’s how engineers tweak couplers for specific applications:
Frequency agility is the first adjustment. A 10 dB coupler at 2.4 GHz becomes 8 dB at 5.8 GHz due to wavelength effects, so designers either:
- Stagger multiple couplers (e.g., 10 dB for 2.4 GHz + 12 dB for 5 GHz)
- Use tunable designs like varactor-loaded microstrips that adjust coupling by ±1.5 dB with 0–30 V bias
- Accept ±0.8 dB ripple and compensate digitally in beamforming algorithms
Power handling forces tradeoffs. A 3 dB hybrid splitting 50 W in a broadcast transmitter must use air-dielectric striplines to avoid arcing, adding 200 to the BOM. Meanwhile, a 20 dB coupler in a 5G small cell handles just 2 W, allowing cheap FR4 substrates at 0.50 per unit.
Environmental factors dictate materials. For:
- Automotive radar (77 GHz, -40°C to +105°C): LTCC-based couplers with ±0.15 dB stability, costing $85 each
- Indoor IoT (2.4 GHz, 0°C to +70°C): PCB-printed couplers with ±1 dB drift, priced at $0.20
- Marine radar (9 GHz, salt spray): Gold-plated waveguide couplers weighing 1.4 kg, $600/unit
Precision vs. cost is a sliding scale. A ±0.1 dB medical imaging coupler requires laser-trimmed alumina substrates and 100% testing, adding 12 days lead time and 300% cost. The same 20 dB ratio in a consumer drone uses untested FR4 with ±2 dB tolerance, shipping same-day at 1/50th the price.
Common Mistakes to Avoid
Even experienced engineers make costly errors with directional couplers—errors that lead to 3 dB signal loss, failed compliance tests, or $50,000 system redesigns. A 0.5 dB miscalculation in a 5G massive MIMO array can reduce cell coverage by 12%, while using the wrong coupler in a satellite payload might leak 2 W of interference into adjacent channels. Here’s how to dodge the worst pitfalls:
Mistake #1: Ignoring Frequency Drift
A 10 dB coupler at 2 GHz rarely stays at 10 dB across its full range. At 6 GHz, it might shift to 8.5 dB, dumping 2.8× more power into the coupled port than expected.
| Frequency | Nominal Coupling | Actual Coupling | Power Leakage Increase |
|---|---|---|---|
| 2 GHz | 10 dB | 10 dB | Baseline (1%) |
| 4 GHz | 10 dB | 9.2 dB | 1.8× (1.8%) |
| 6 GHz | 10 dB | 8.5 dB | 2.8× (2.8%) |
Mistake #2: Overloading the Coupled Port
A 20 dB coupler rated for 1 W input can only handle 10 mW at the coupled port. Pump in 30 dBm (1 W), and the monitoring diode burns out in 47 seconds—silently killing your test setup.
Mistake #3: Assuming Perfect Directivity
Even “high-directivity” 30 dB couplers leak 0.3% of reverse signals. In a full-duplex radar, this causes -55 dBc self-interference, raising the noise floor by 4 dB.
Mistake #4: Neglecting Temperature Effects
A $5 FR4 coupler drifts 0.1 dB/°C—fine in a 70°F lab, but in a 150°F RF cabinet, its 15 dB coupling becomes 13.5 dB, skewing power measurements by 30%.
Mistake #5: Cheap Connectors on Precision Couplers
A 0.50 SMA jack adds 0.4 dB inconsistency, wasting 90% of the precision you paid for.
Quick Fixes for Common Disasters:
- For frequency drift: Pre-measure coupling at 5+ frequency points and program corrections into your DSP
- For overloading: Always insert a 3–10 dB attenuator before the coupled port (e.g., Mini-Circuits VAT-3W2+)
- For temperature drift: Specify ±0.02 dB/°C parts for outdoor use, or add Peltier coolers to critical units
- For connector issues: Use 3.5 mm or N-type connectors for frequencies >2 GHz, torque to 8 in-lb


